Food cost
What your plates actually cost this week, against what you charged for them.
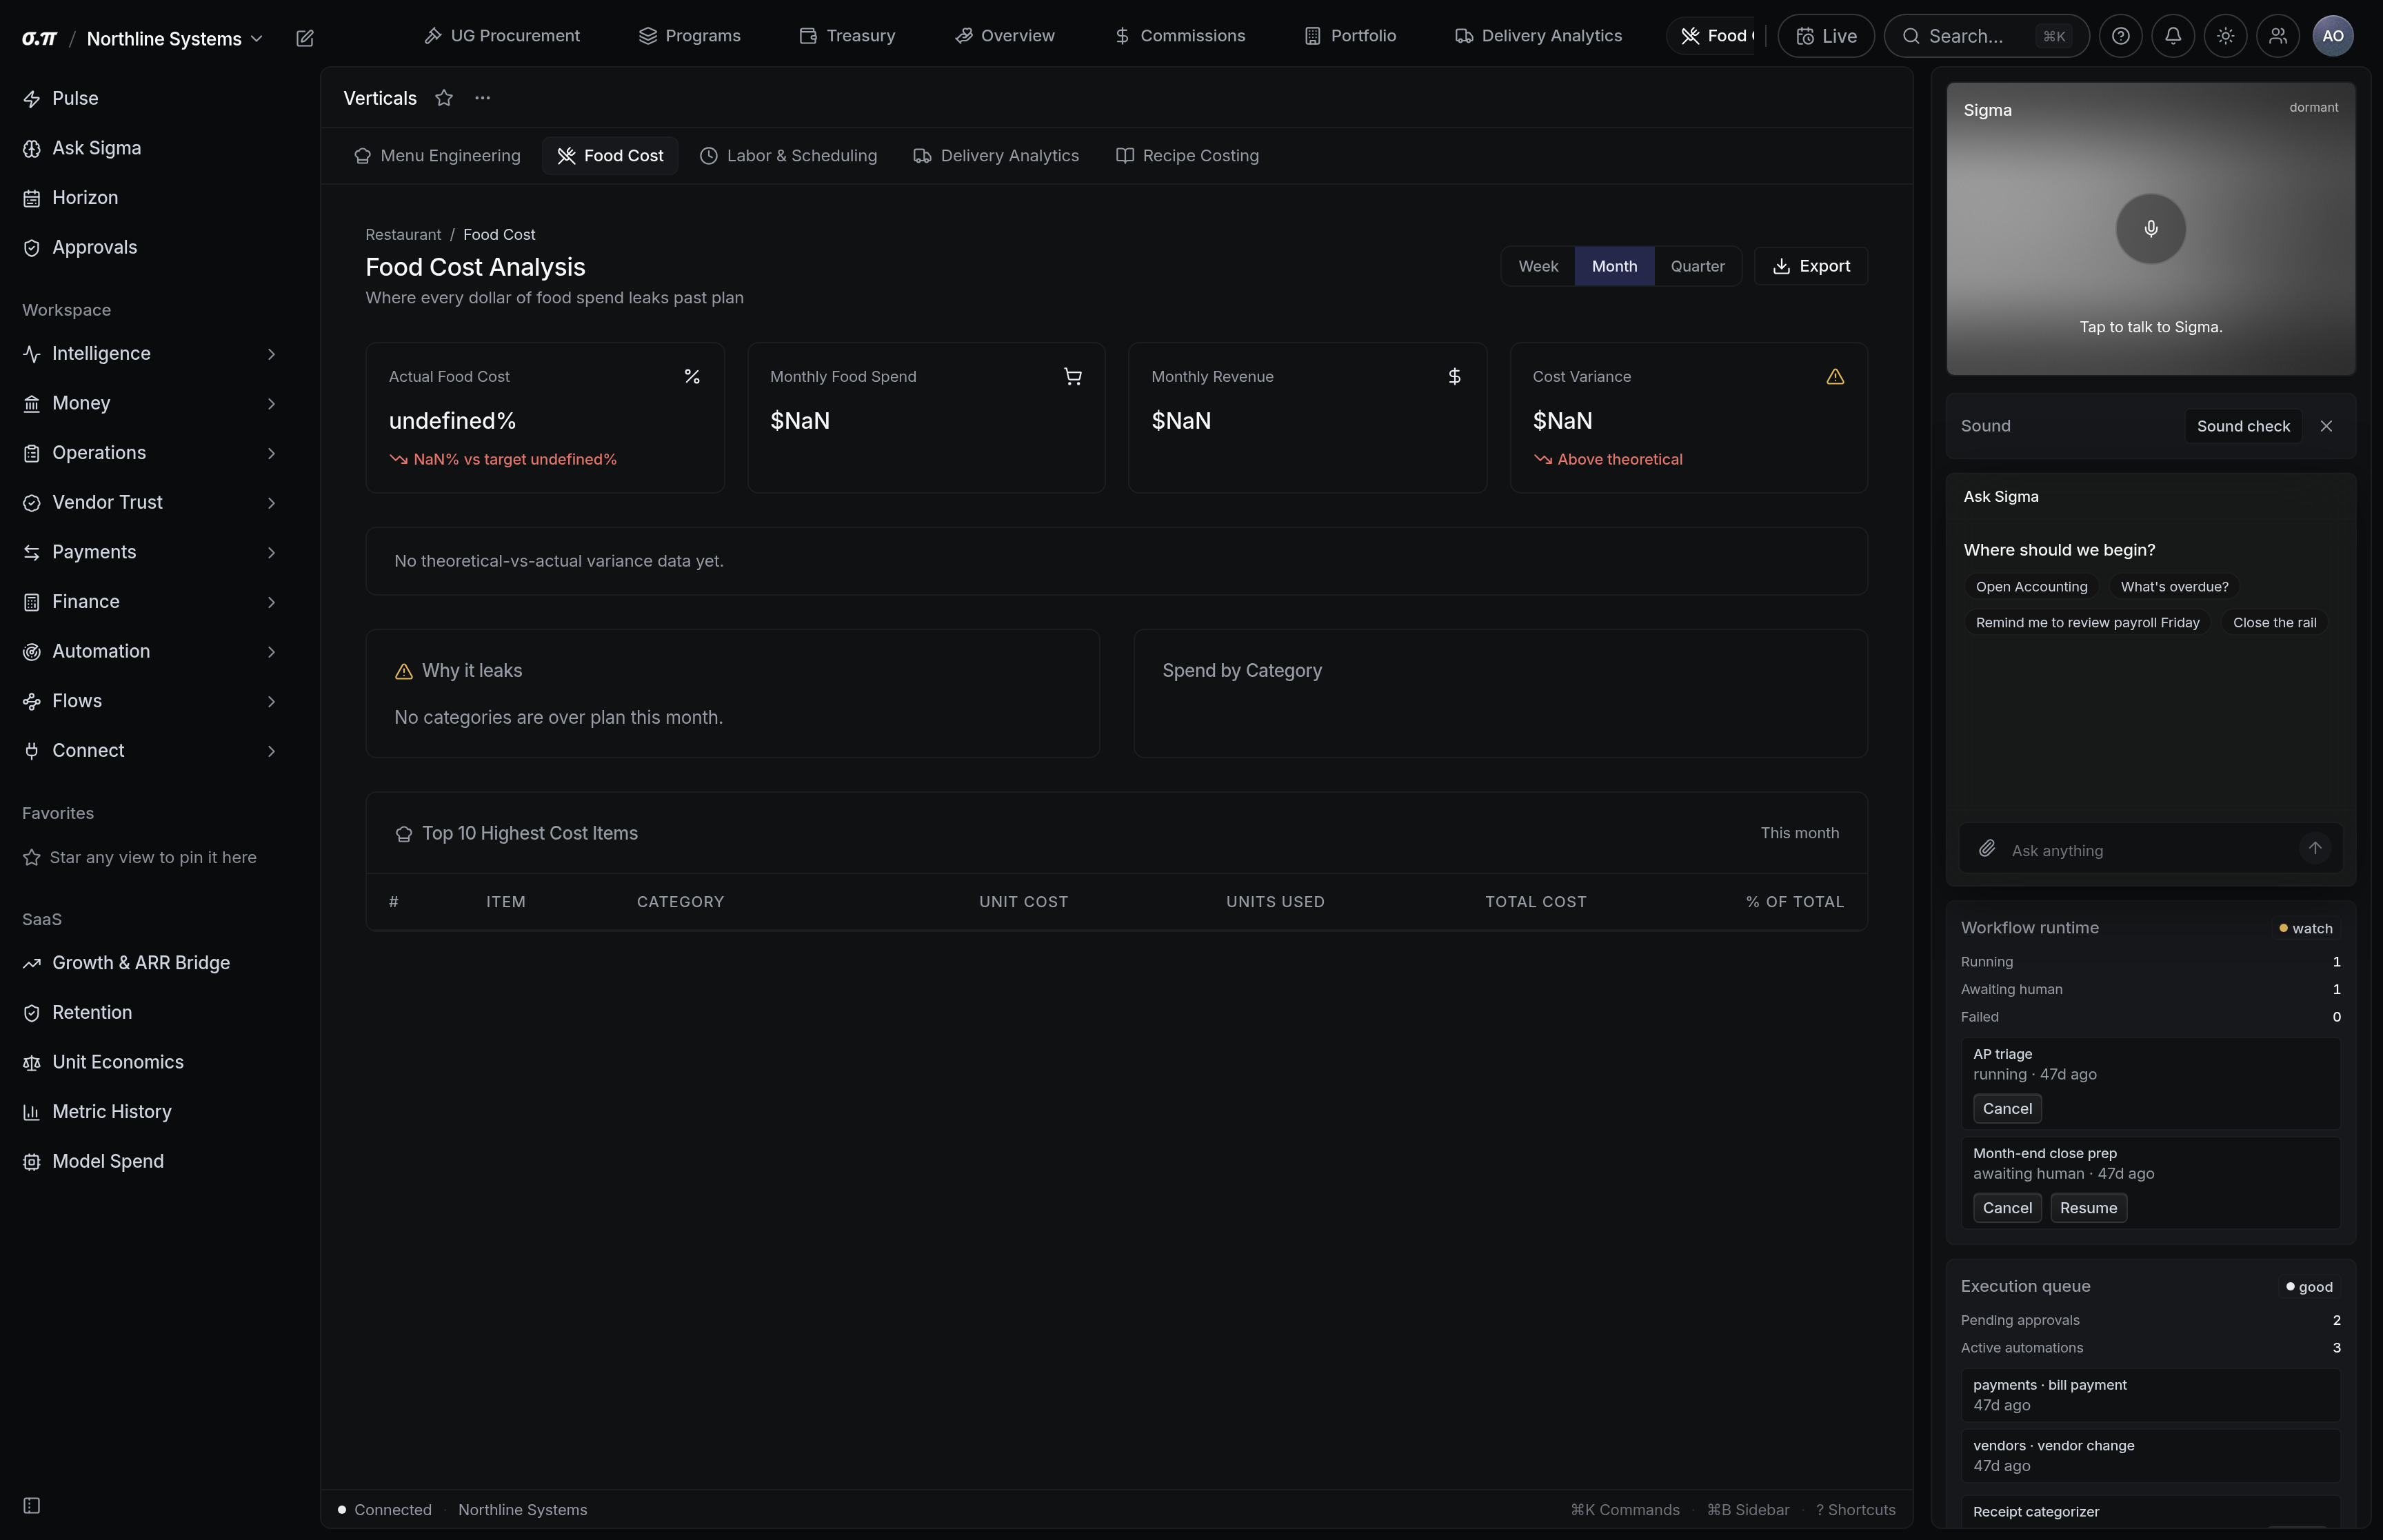
Food cost percentage is theoretical cost against actual sales. Theoretical is what your recipes say the food should have cost for the covers you served. Actual is what you spent. The gap between them is waste, theft, over-portioning, or a supplier price that moved without telling you.
This page computes both from invoices and sales and shows the variance by category, so a jump in protein cost does not hide inside a stable overall percentage.
Where everything sits
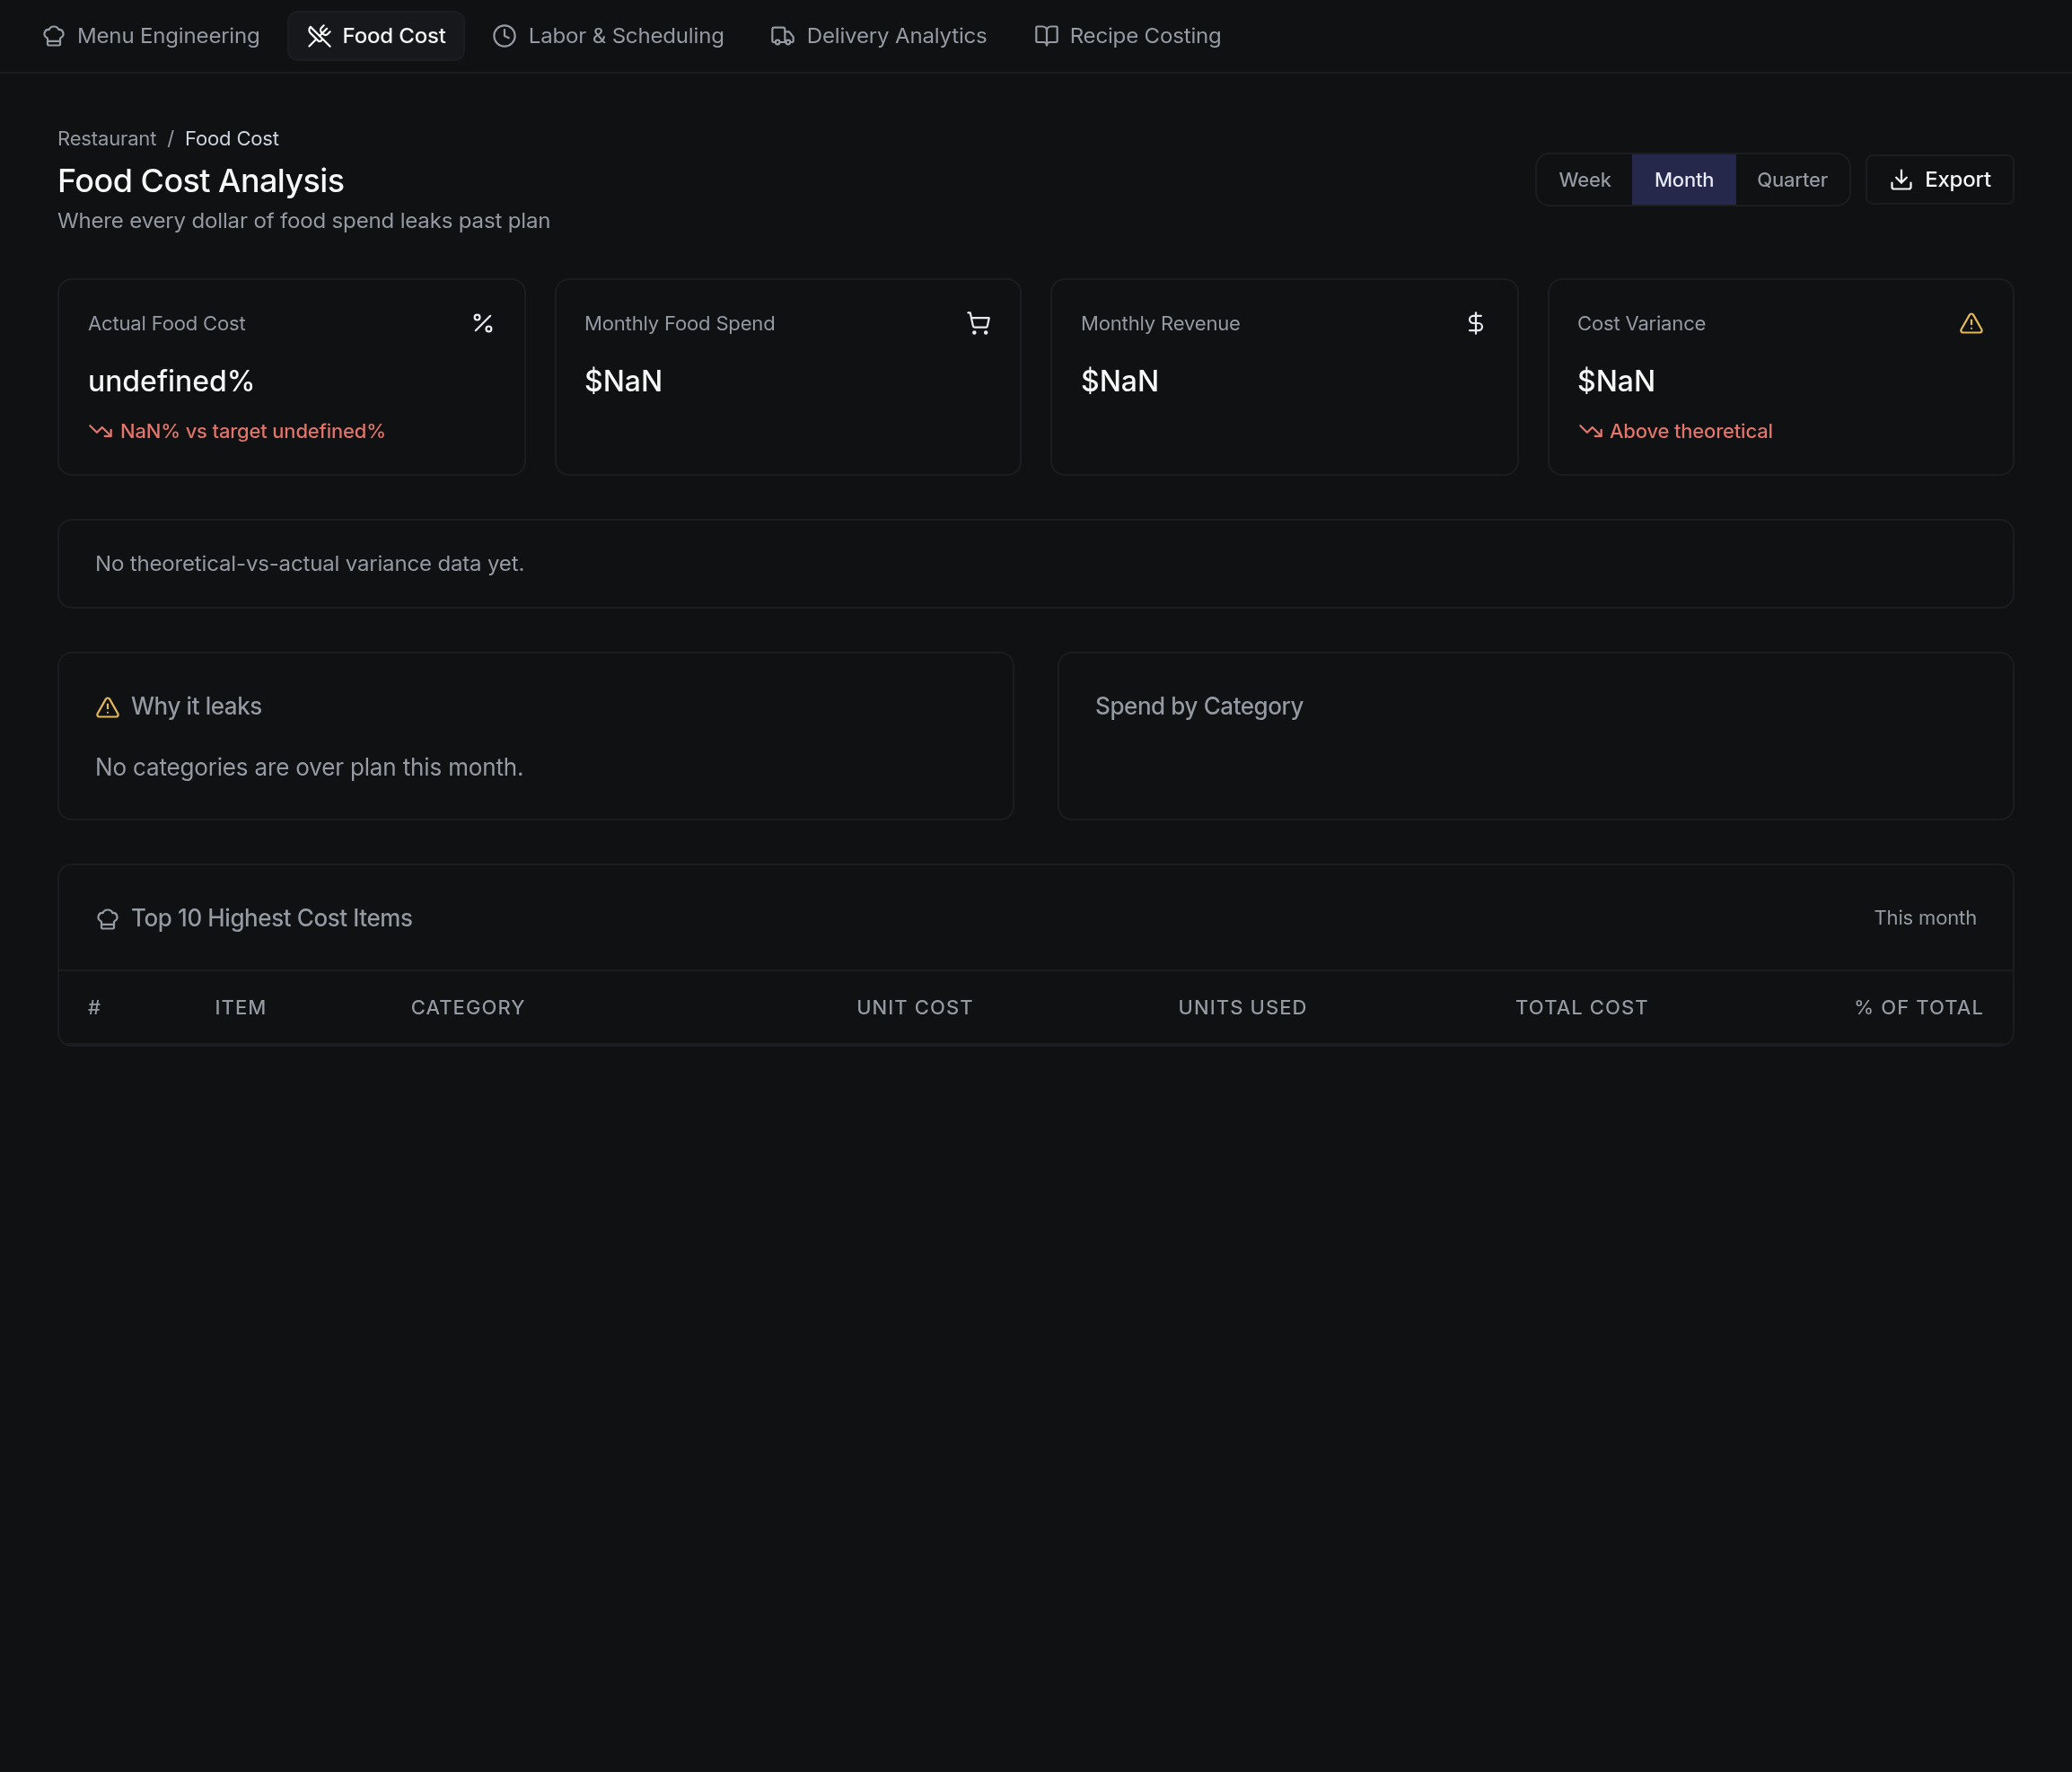
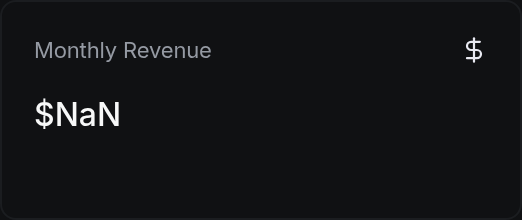
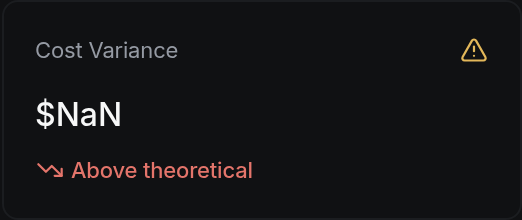

How to work this page
Theoretical cost is impossible without recipes. Cost the twenty items that make up most of your covers and you have most of the value, without costing the whole menu.
Protein, produce, dairy, dry goods, beverage. A single overall percentage hides the category that moved.
The same item across successive invoices is compared. A price that rose quietly over six weeks shows as a line, not a surprise.
A 31 percent food cost is fine or terrible depending on your model. The theoretical to actual gap is the number that means the same thing in every restaurant.
On a phone
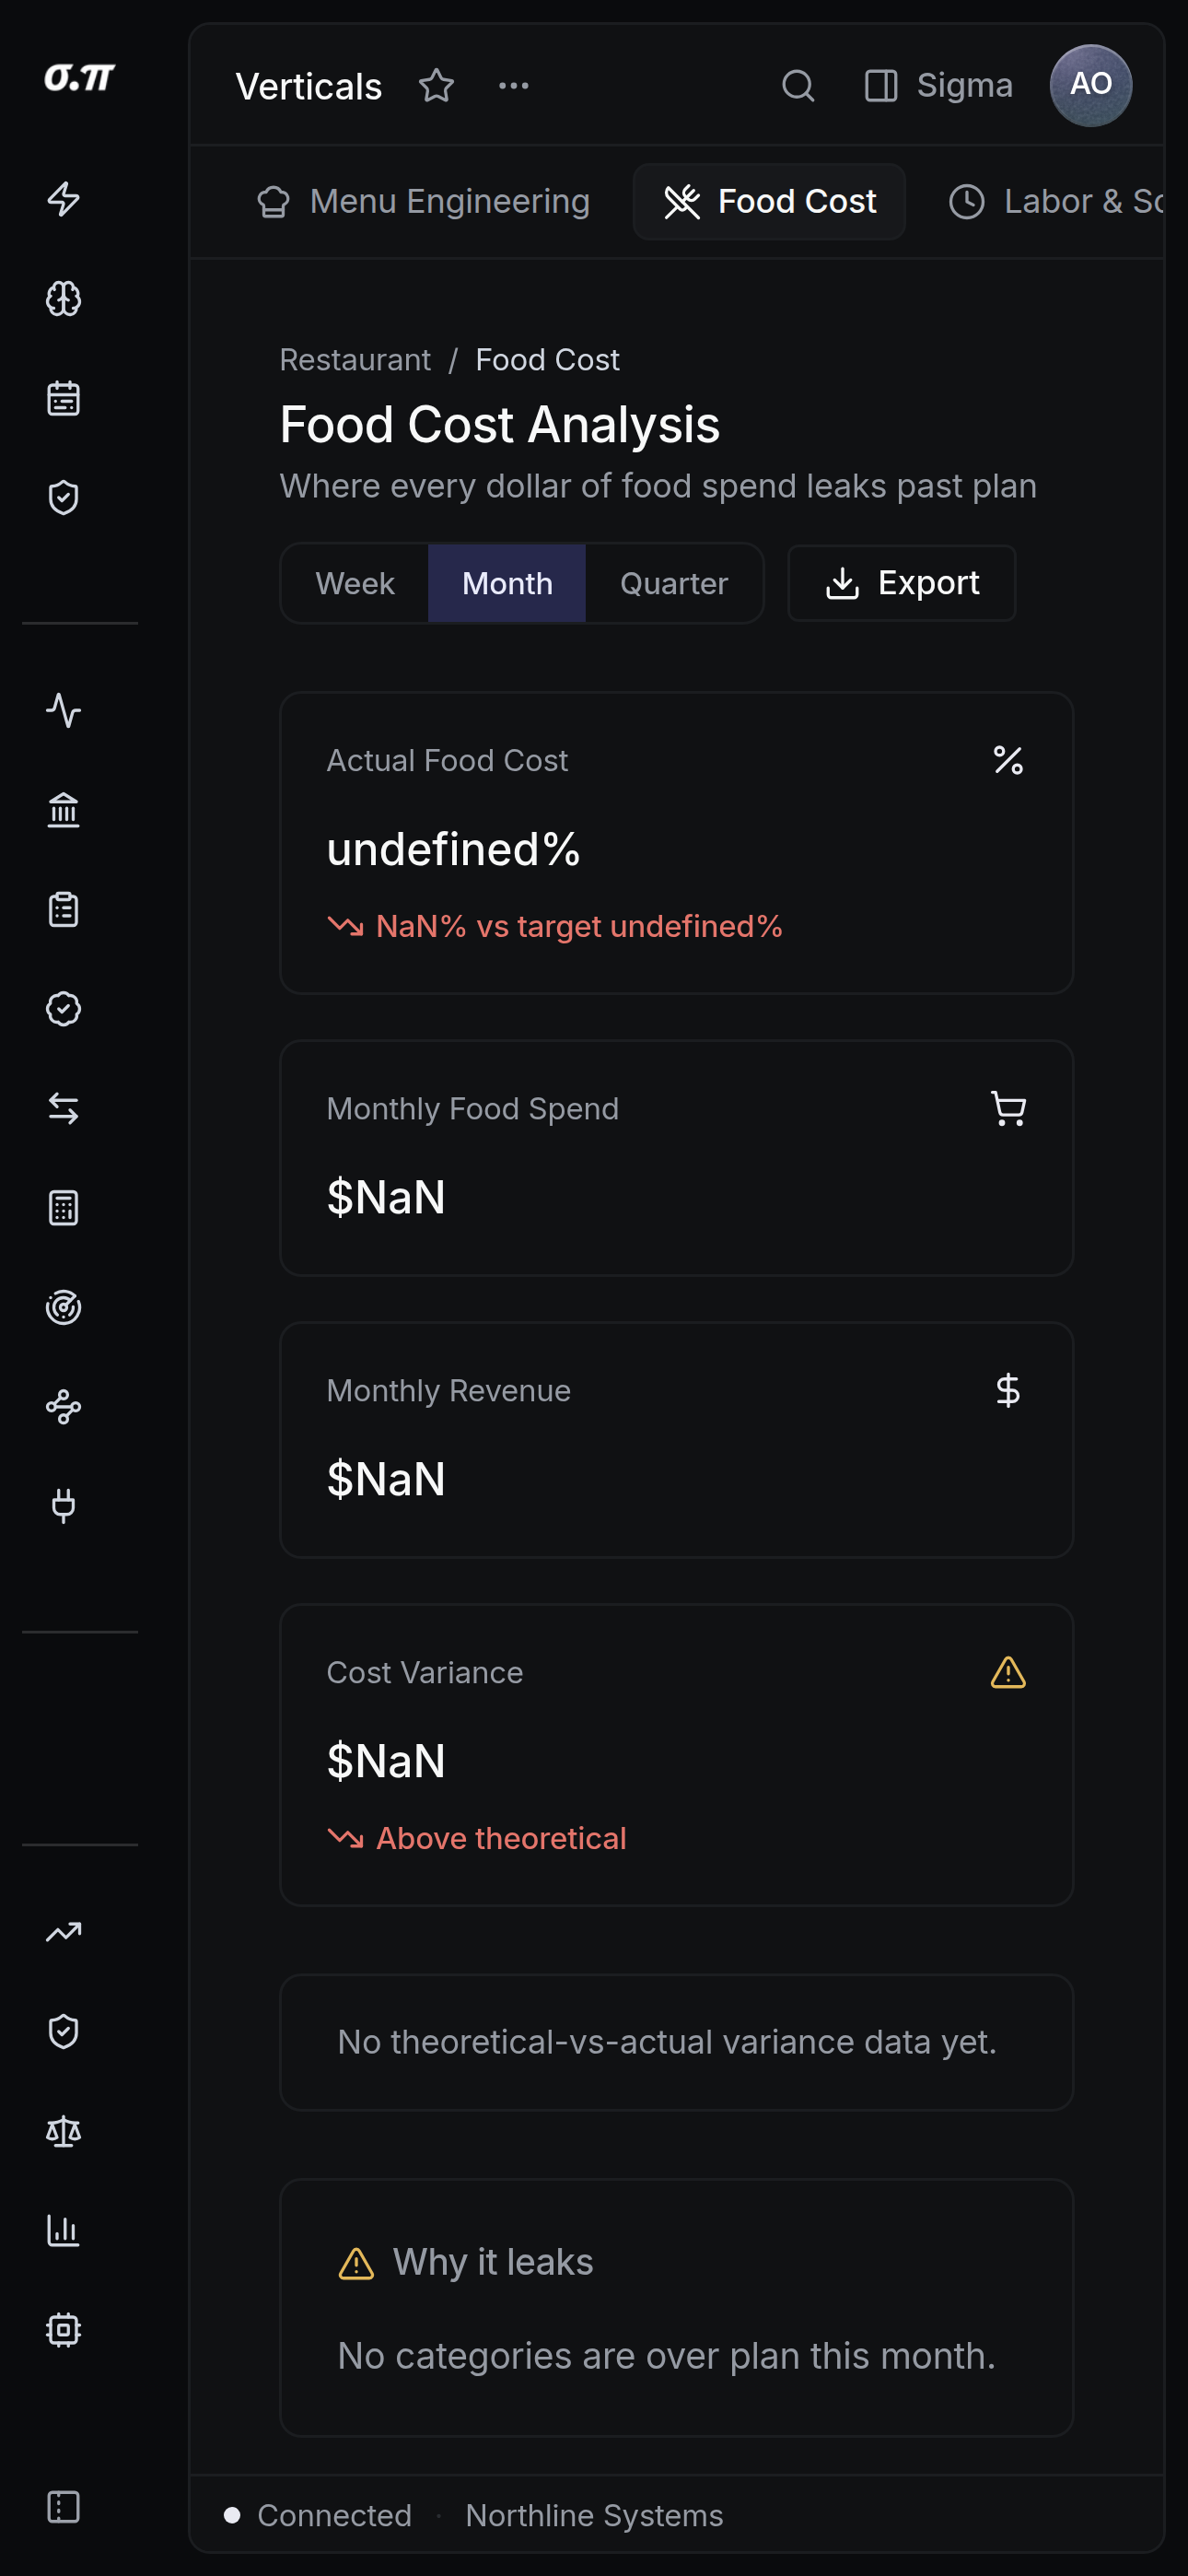
Every figure from the desktop appears here, stacked rather than reduced. Tables scroll inside themselves so the page never moves sideways, and figures keep their separators and their alignment at every width.
Questions people actually ask
Recorded waste reduces the gap because it explains it. Unrecorded waste sits inside the unexplained variance, which is the point of separating the two.
Menu engineering handles those. A loss leader is a decision, and it is marked as one so it does not read as a costing error here.