Property portfolio
Every property, what it earns, what it costs, and what it is worth.
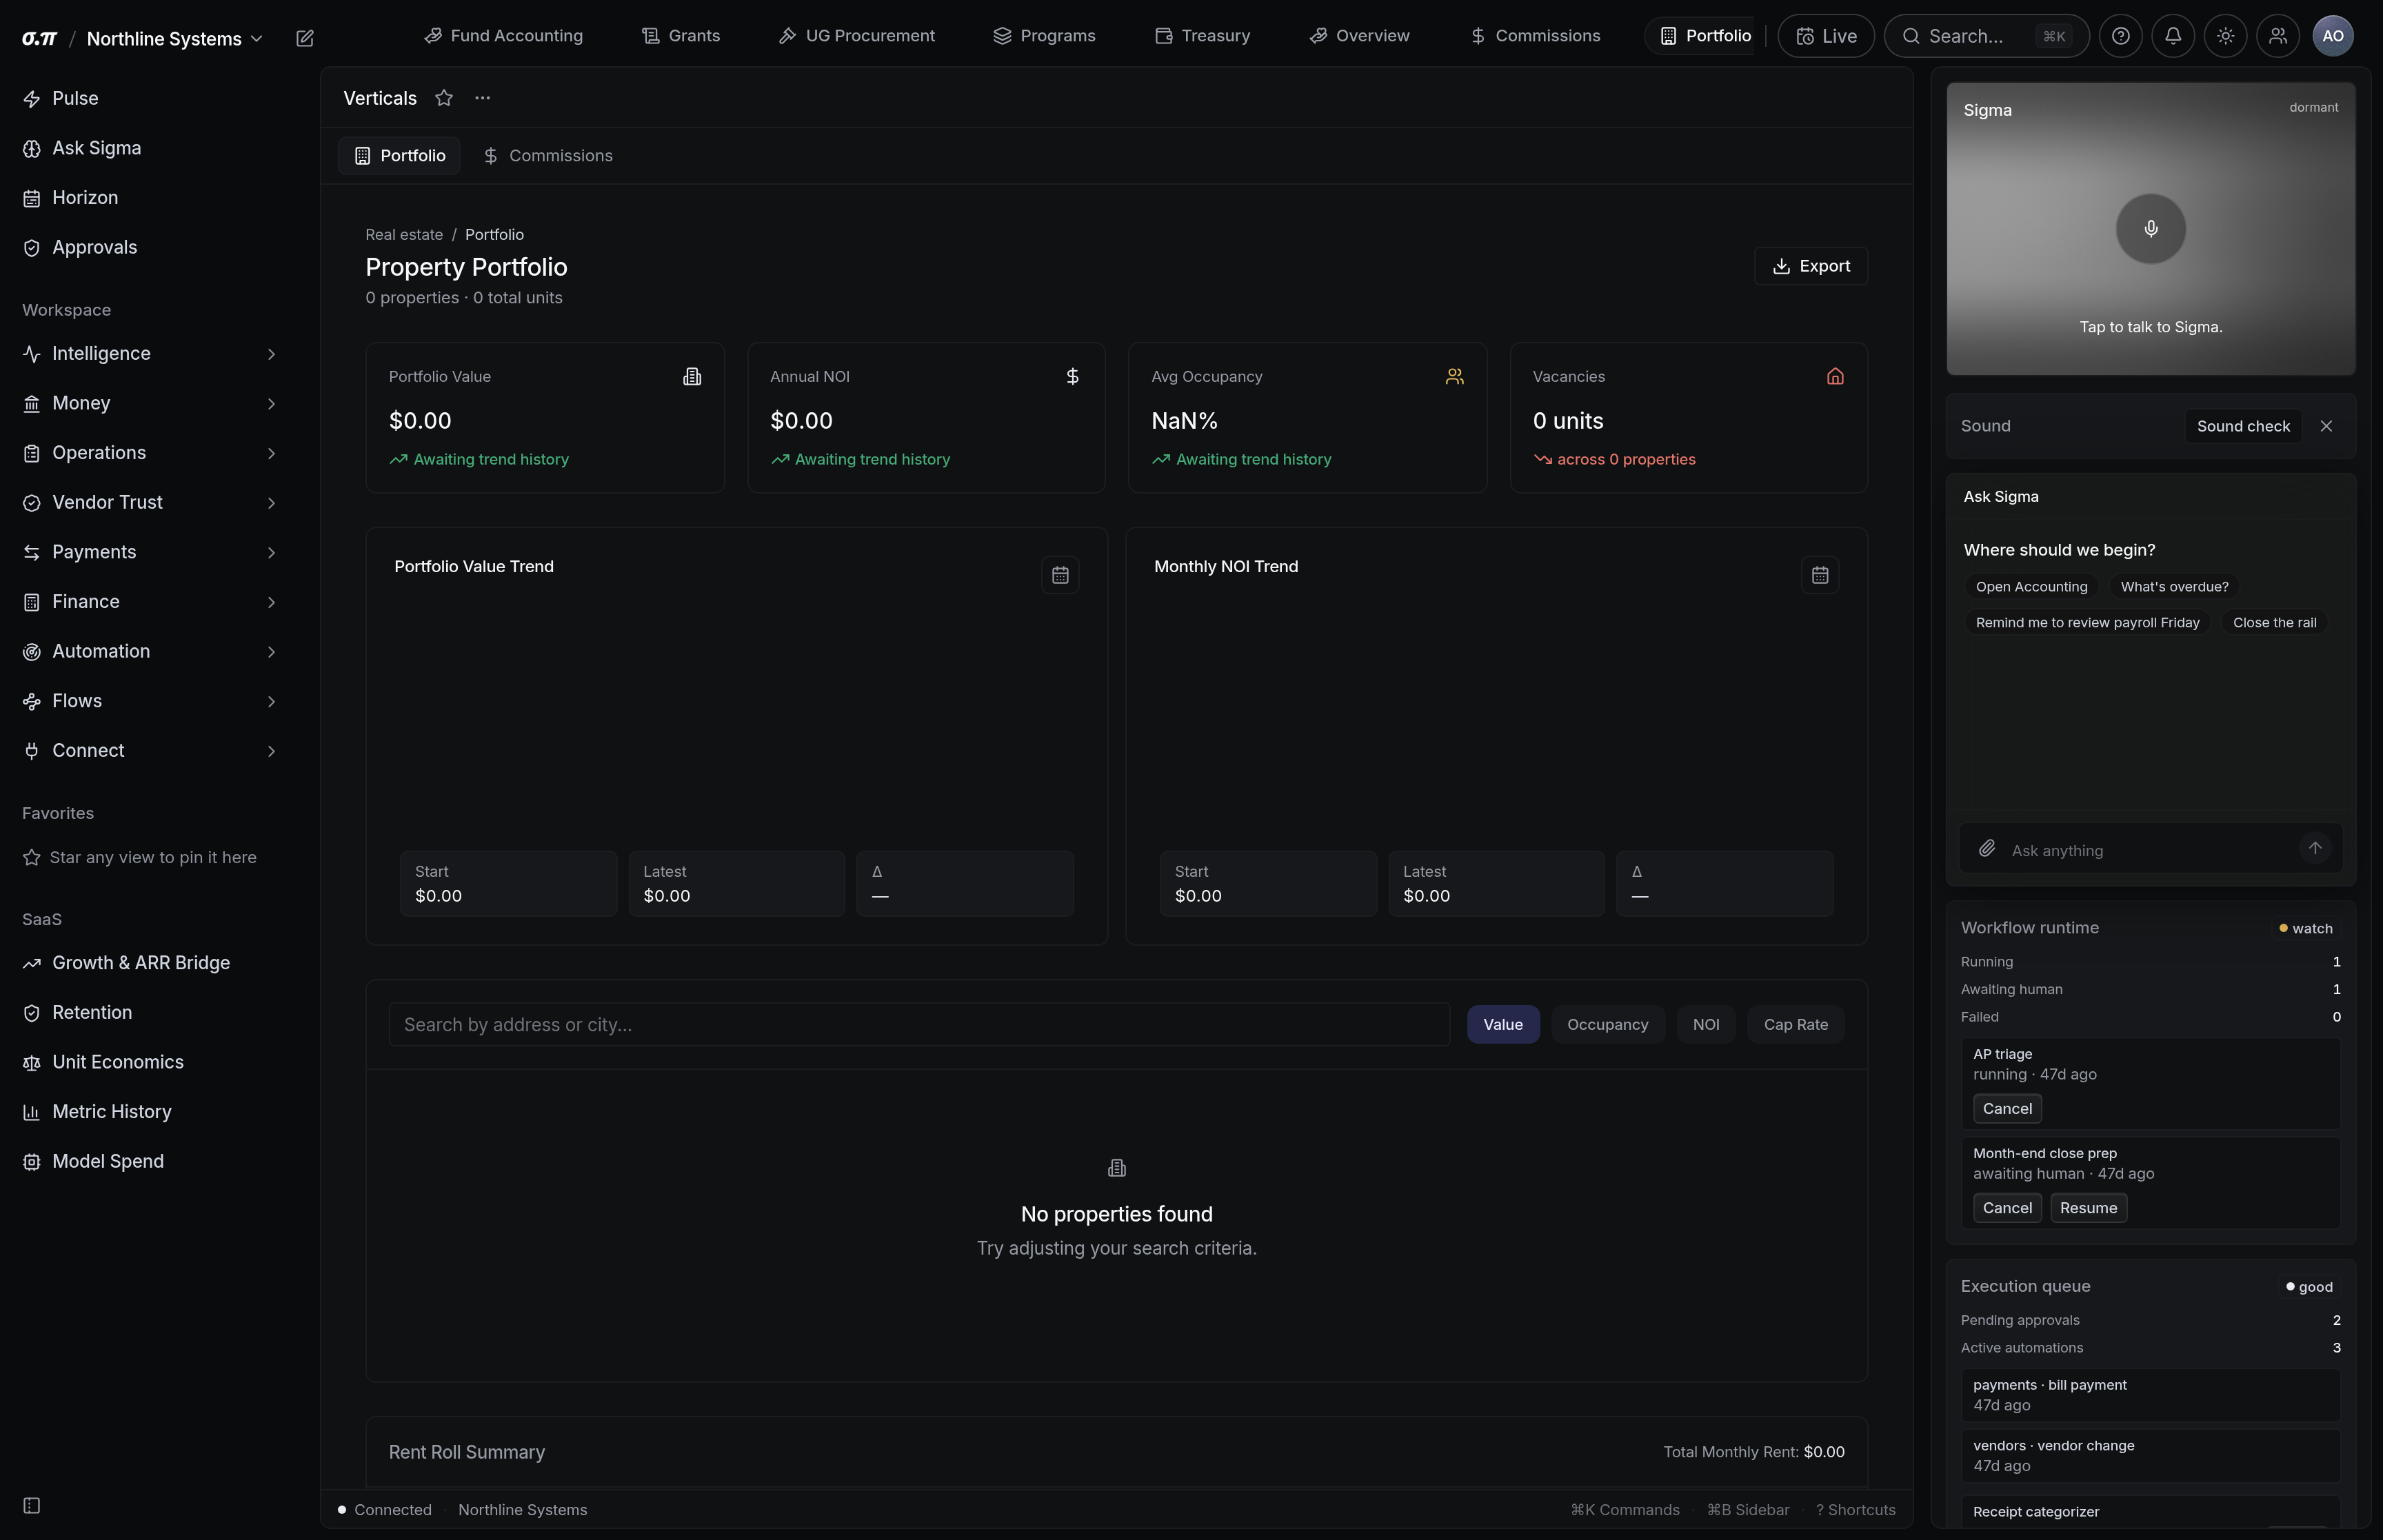
Net operating income per property, debt service against it, and the resulting cash flow. Occupancy and lease expiry sit alongside, because a property fully occupied on leases expiring next quarter is a different asset from one on long leases.
Debt service coverage is the number a lender watches and the one that triggers a covenant.
Where everything sits
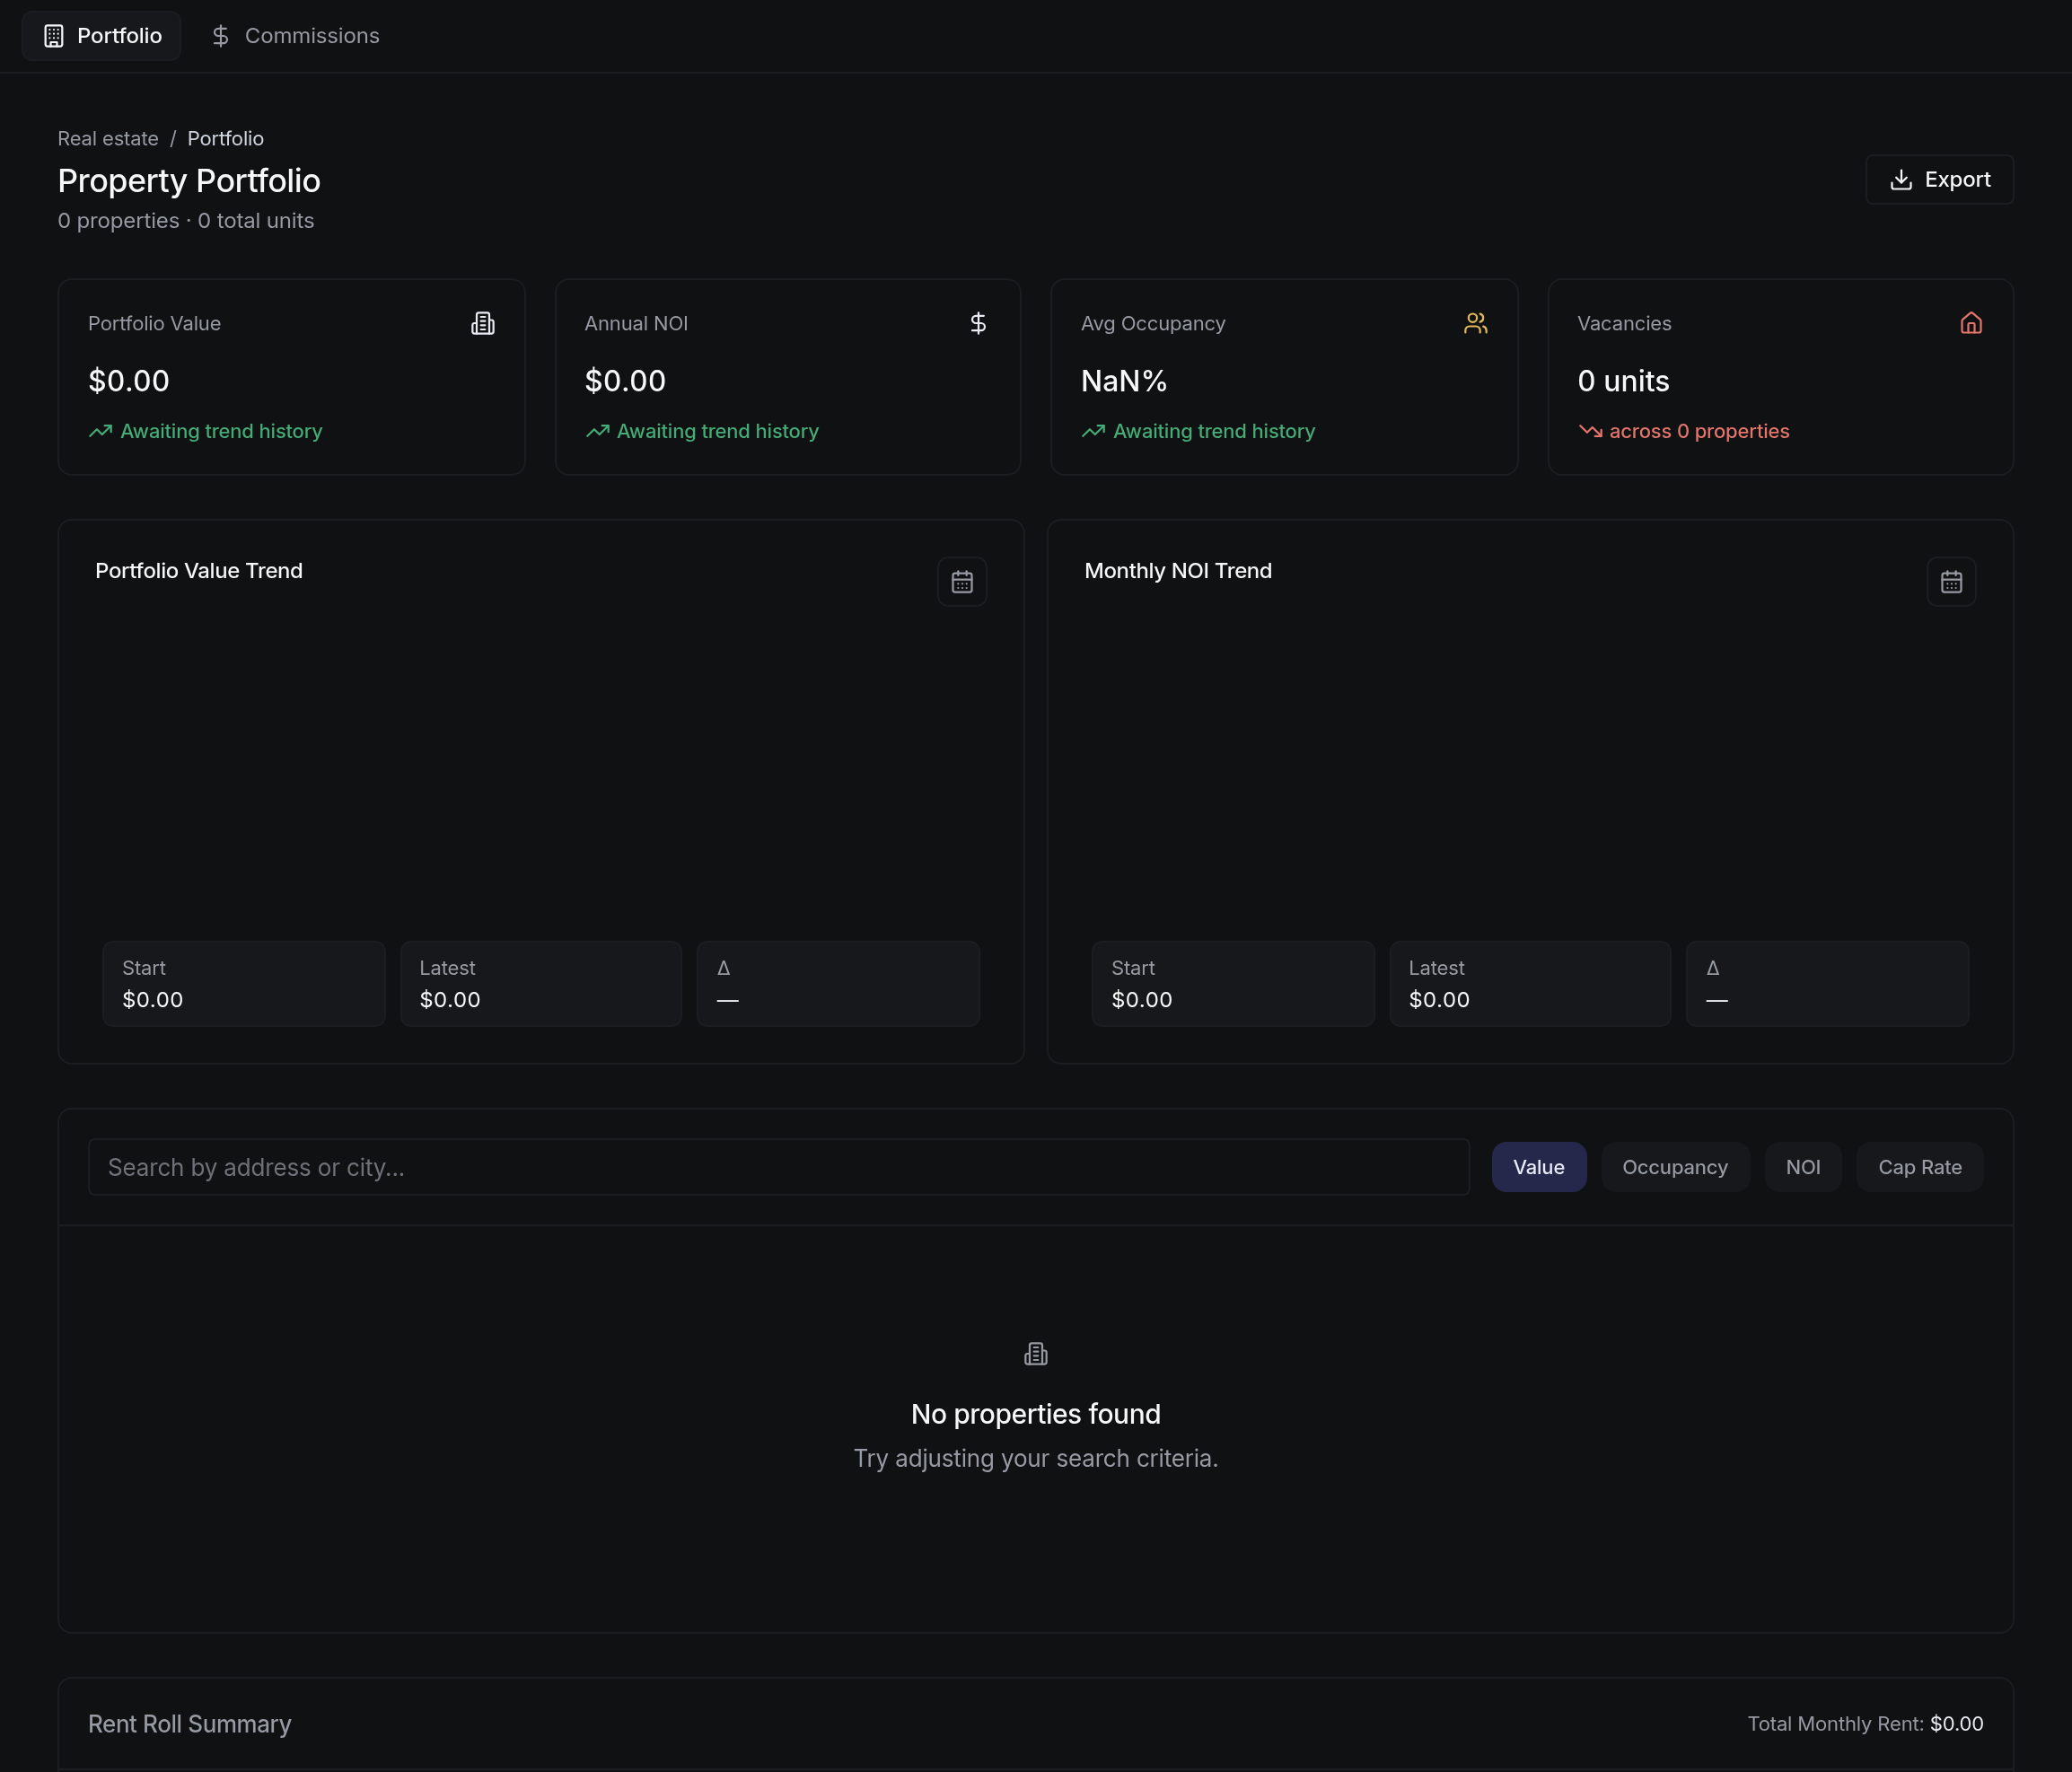





How to work this page
Income less operating expenses, before debt. It is the property's own performance and it is what valuation follows.
Net operating income divided by debt service. Loan covenants set a minimum and breaching it has consequences beyond the payment.
Concentrated expiries are a risk even at full occupancy. The schedule shows where they cluster.
A roof is capital and depreciates. A repair is operating and hits this year. The split changes both net operating income and tax.
On a phone
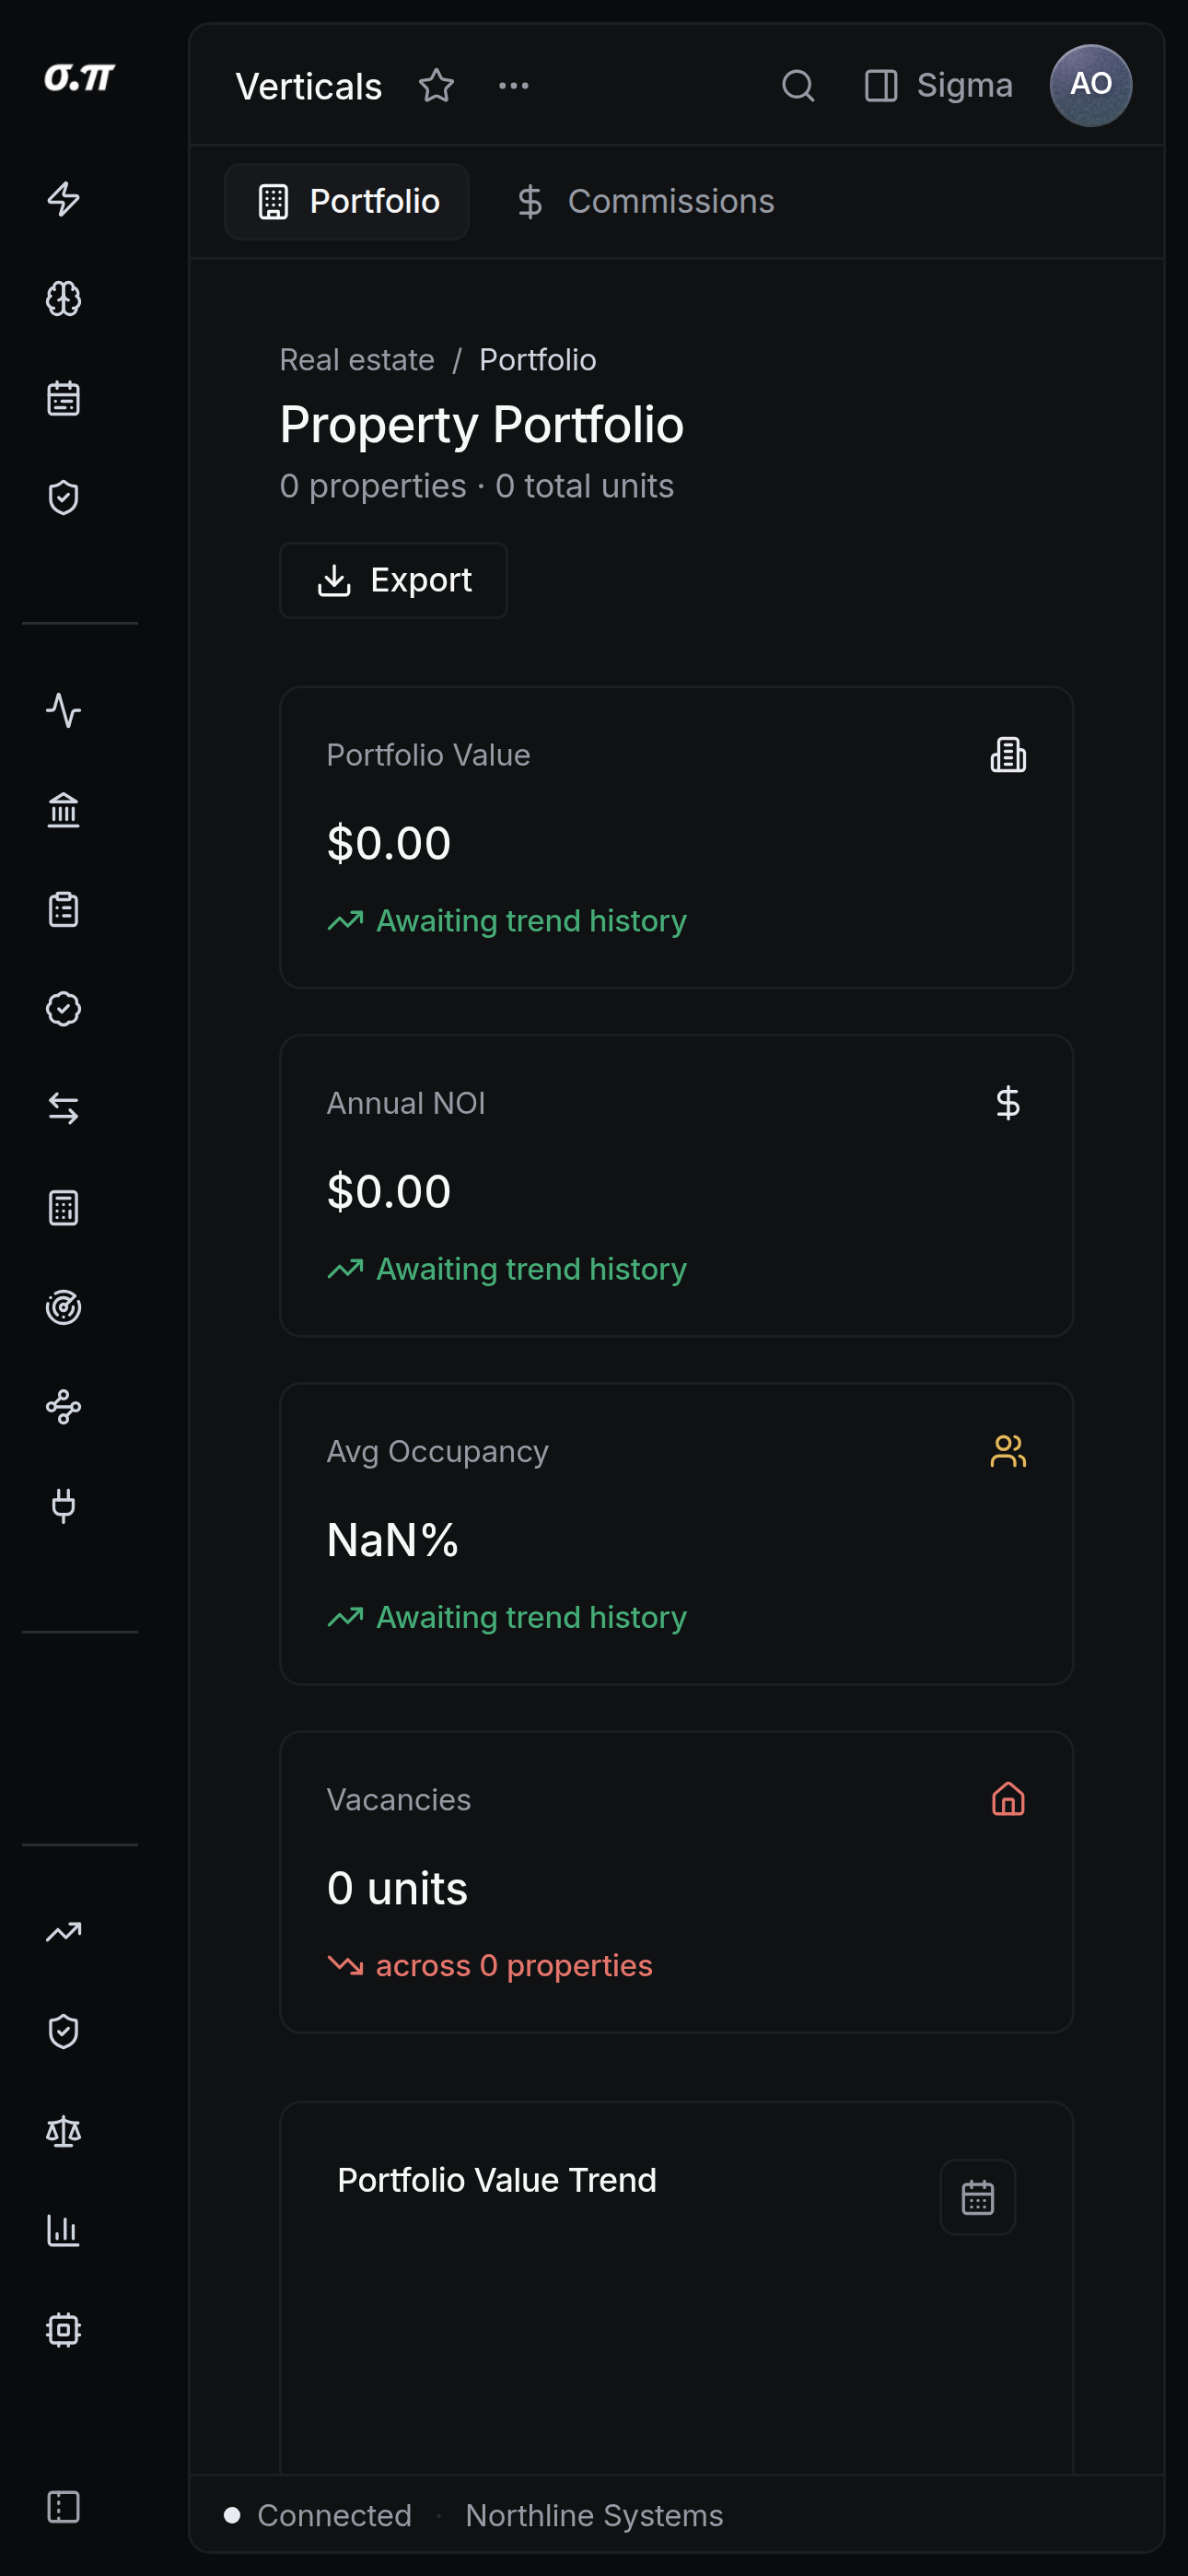
Every figure from the desktop appears here, stacked rather than reduced. Tables scroll inside themselves so the page never moves sideways, and figures keep their separators and their alignment at every width.
Questions people actually ask
Net operating income divided by a capitalisation rate, with the rate recorded and dated because it is an assumption rather than a fact.
Each is its own entity with its own books, consolidated for the portfolio view. The separation is what preserves liability isolation.