Risk radar
The exposures that would hurt, sized, with the stress that produced each number.
Risk here is not a score for its own sake. Each exposure is a specific thing that could happen, with the amount at stake and the assumption behind it stated.
Concentration, liquidity, counterparty and operational exposures are computed from your actual positions. The stress lab runs scenarios against them so the effect of a shock is a number rather than a feeling.
Where everything sits

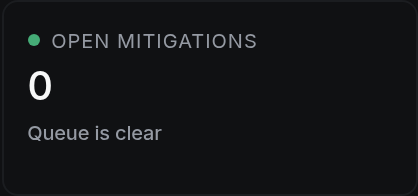
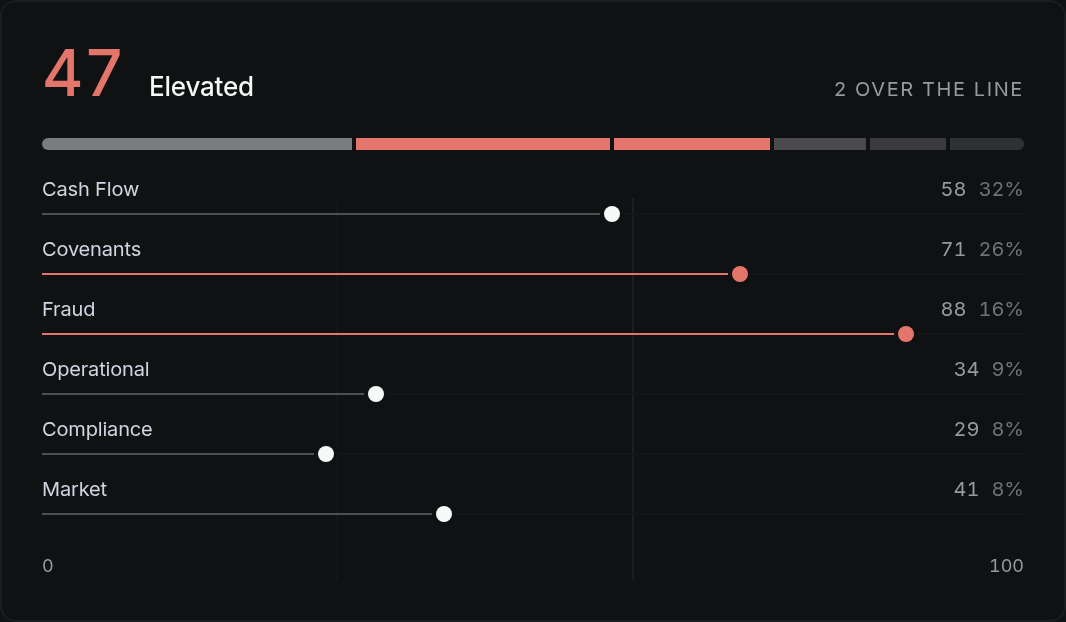
How to work this page
Revenue from your largest customer, spend with your largest supplier, cash at your largest bank. Concentration is the exposure that most often ends small companies.
How many days of committed outflow your liquid position covers. It is the number that turns a slow month into a survivable one or not.
A customer defaults, collections slow by thirty days, revenue drops a quarter. Each produces the resulting position rather than a rating.
Every exposure states what it assumed. A risk number without its assumption is not usable.
On a phone
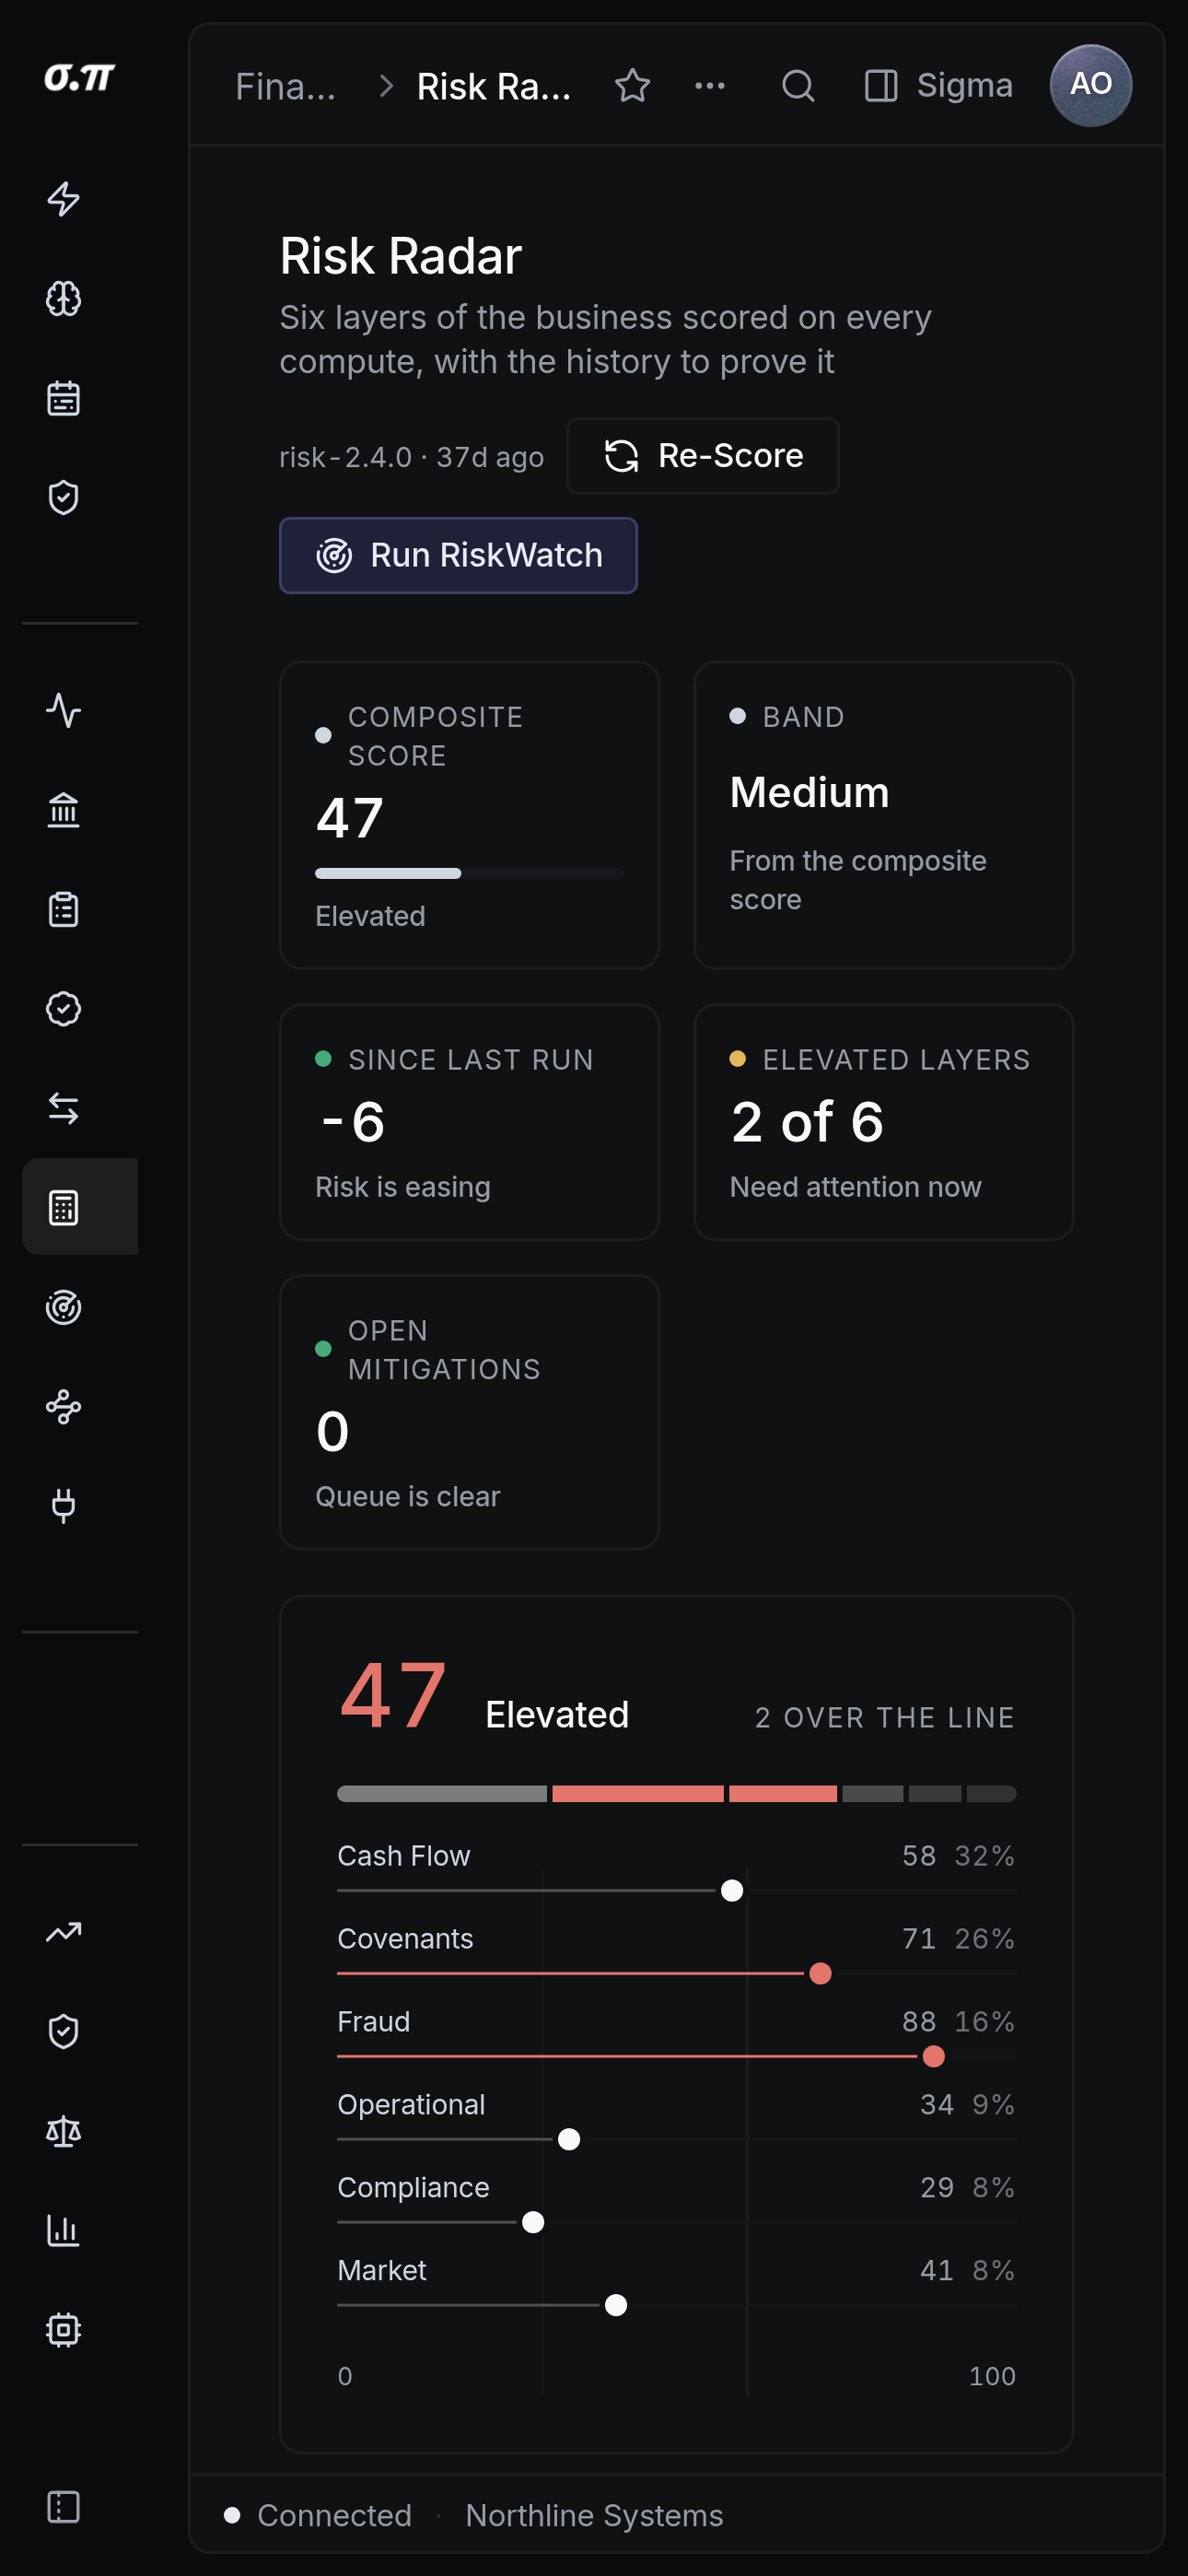
Every figure from the desktop appears here, stacked rather than reduced. Tables scroll inside themselves so the page never moves sideways, and figures keep their separators and their alignment at every width.
Questions people actually ask
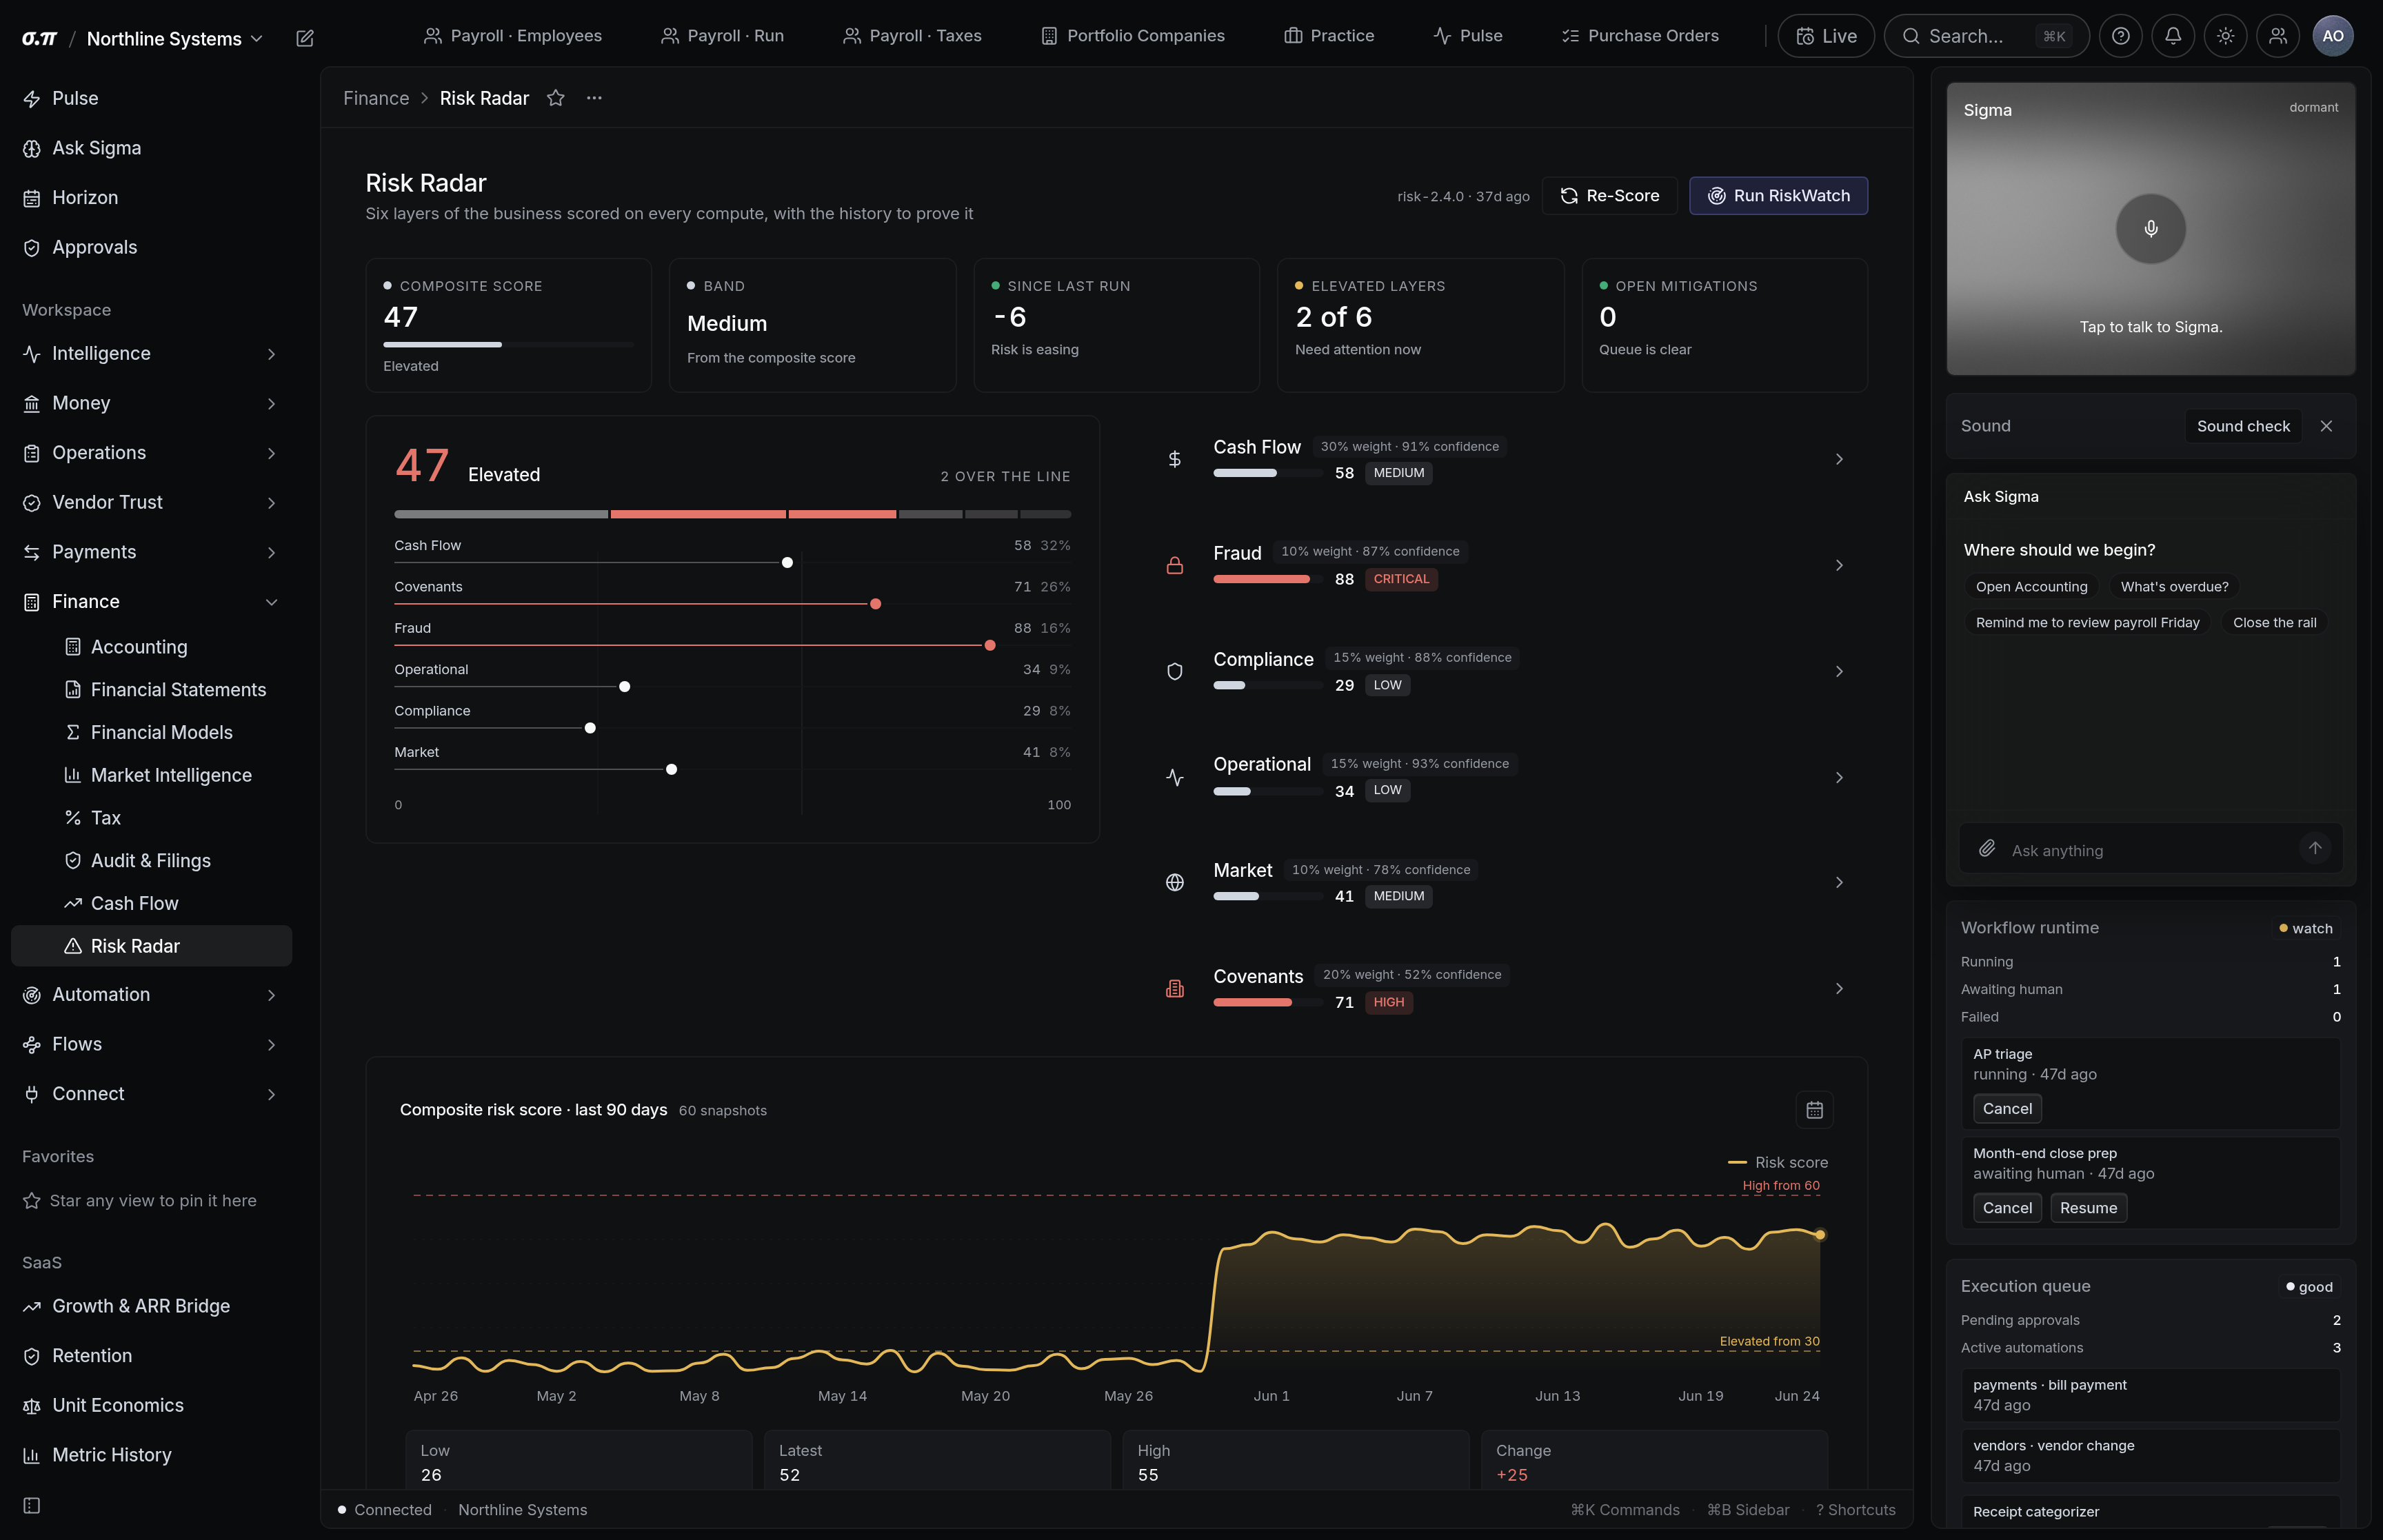
From execution health, connector integrity, liquidity cover and workflow completion, weighted. The components are always shown, because the composite alone tells you nothing actionable.
Yes. Thresholds per exposure trigger a notification when crossed, so a deteriorating position finds you.