Atlas
Where the business actually operates, and what each place is contributing.

Locations, customers and counterparties placed geographically, with the money attached to each. A map is only useful in a financial system if the figures are on it, and these are.
Concentration is easier to see on a map than in a table. A business that believes it is national and is actually three cities finds that out here.
Where everything sits

How to work this page
Revenue by place. Most businesses are more concentrated than they think and the map makes it obvious.
Activity in a state is what creates obligations there. The map and the tax pages agree because they read the same data.
Each point carries its own revenue, cost and margin rather than being a dot.
Where growth is coming from geographically is a different question from how much, and it changes where you invest.
On a phone
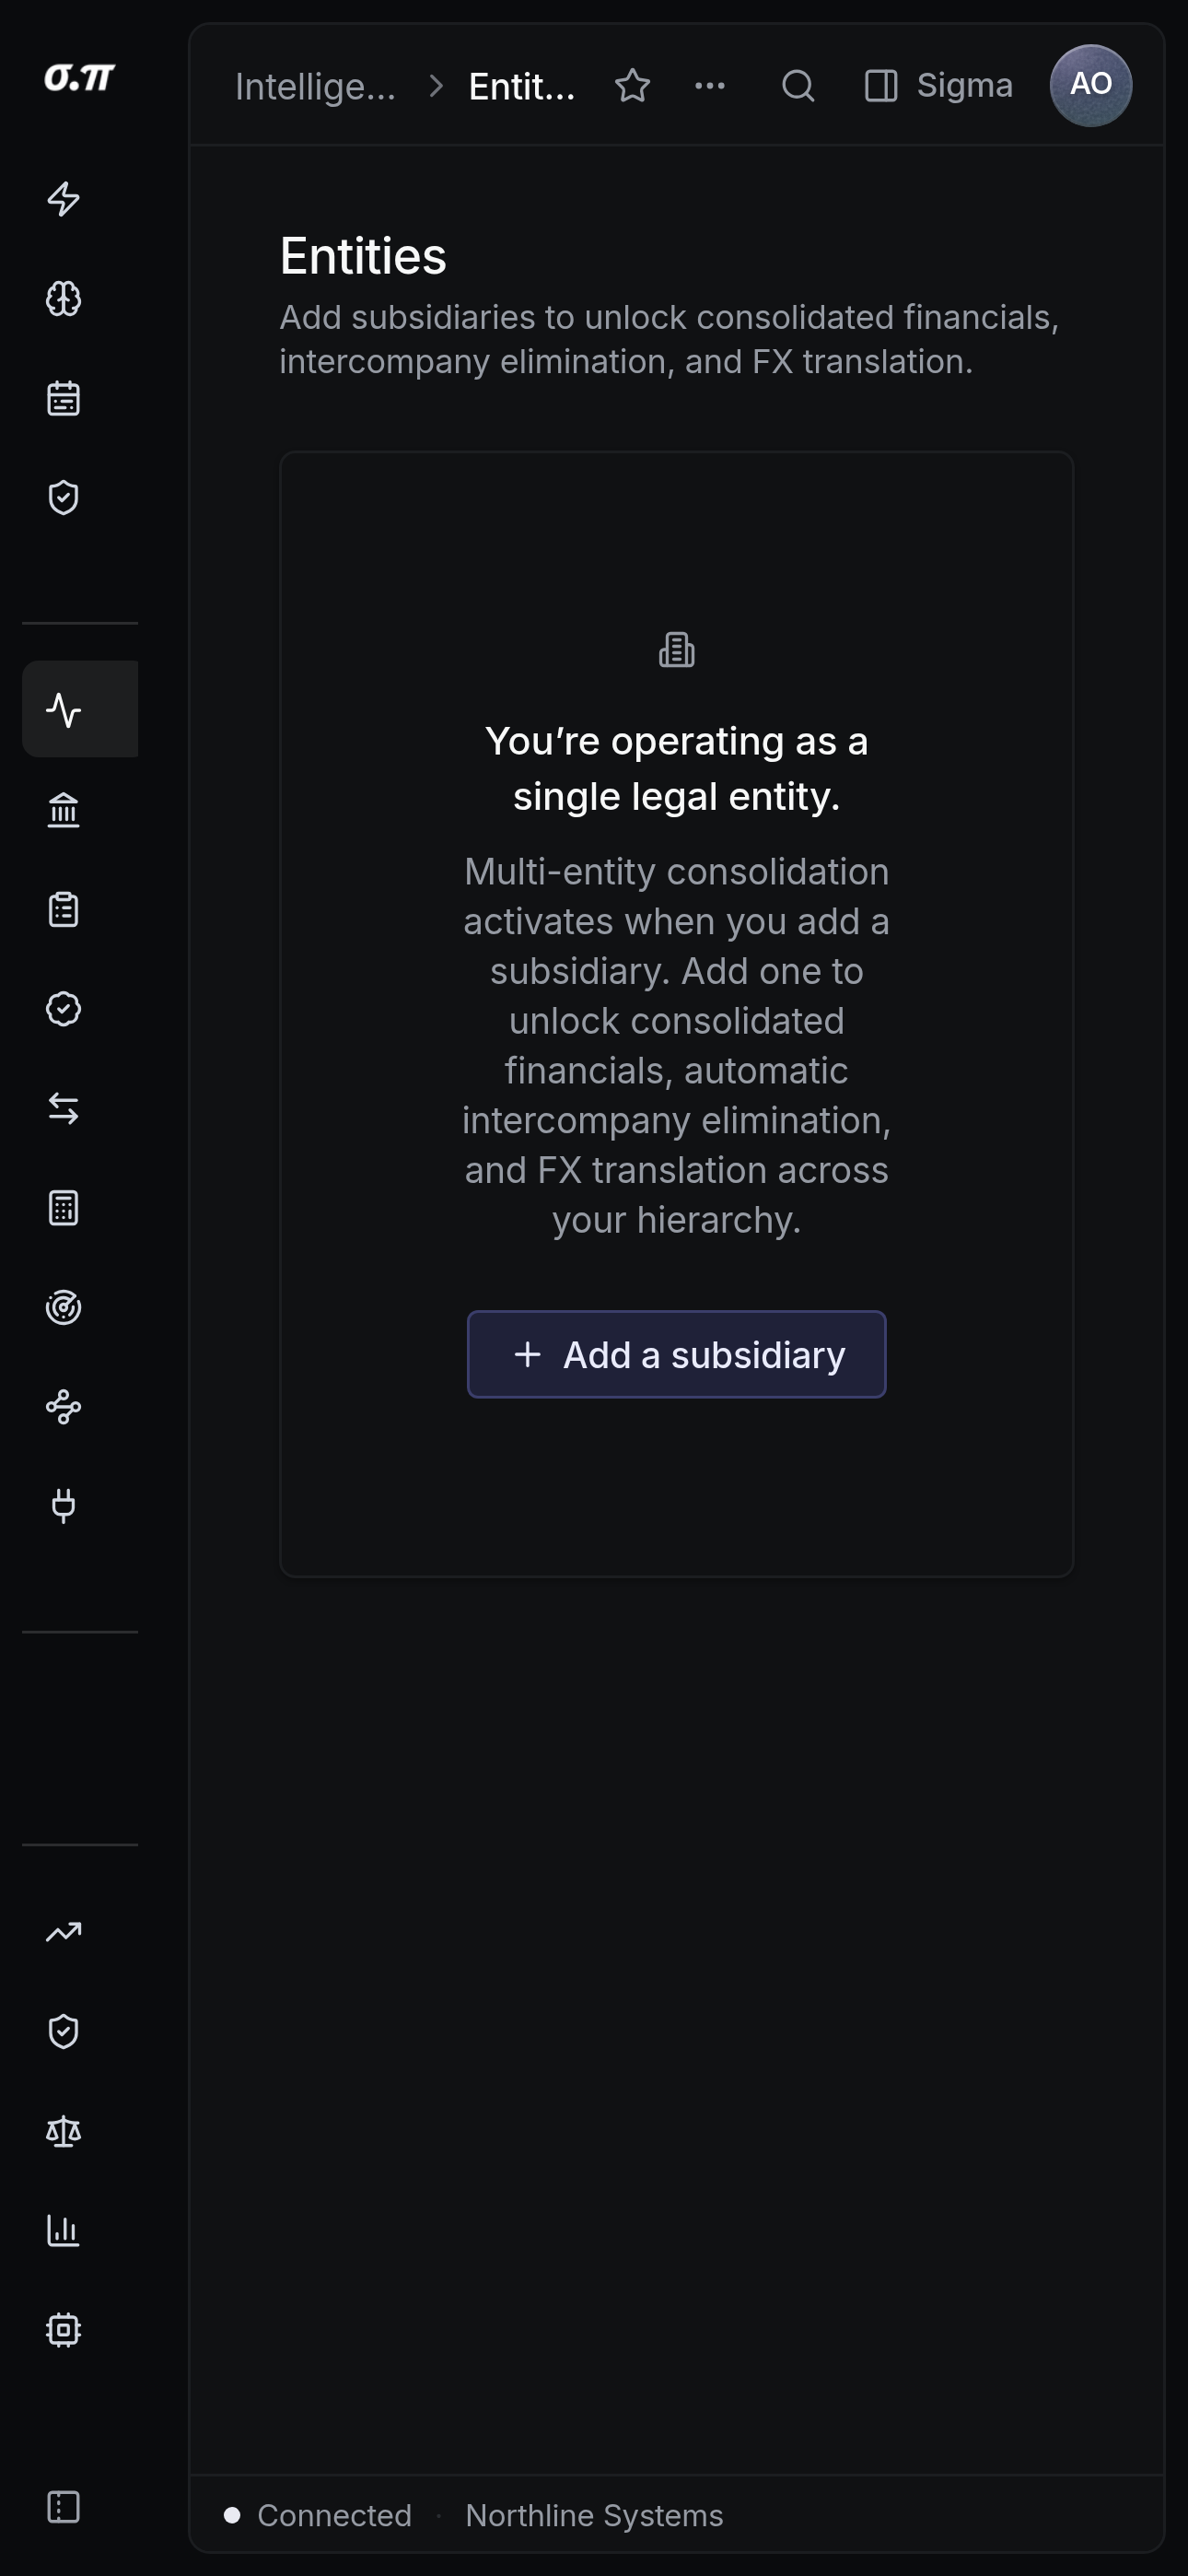
Every figure from the desktop appears here, stacked rather than reduced. Tables scroll inside themselves so the page never moves sideways, and figures keep their separators and their alignment at every width.
Questions people actually ask
Customer and vendor addresses, your own recorded sites, and transaction origins. Nothing is inferred from an IP address.
It reflects them. Activity in a state creates the obligation and this shows you the activity. State Intelligence carries the thresholds.